Bundle of Joy Start free

Weight, height and head circumference

Your baby’s growth, against WHO standards.

A baby growth chart app that plots weight, height and head circumference on the WHO growth standards, with your baby’s percentile on the chart. It shows your numbers and leaves the questions to your pediatrician. Free, for both parents.

Free for two, no card · Set up in a minute · No ads, no AI, no feed to scroll

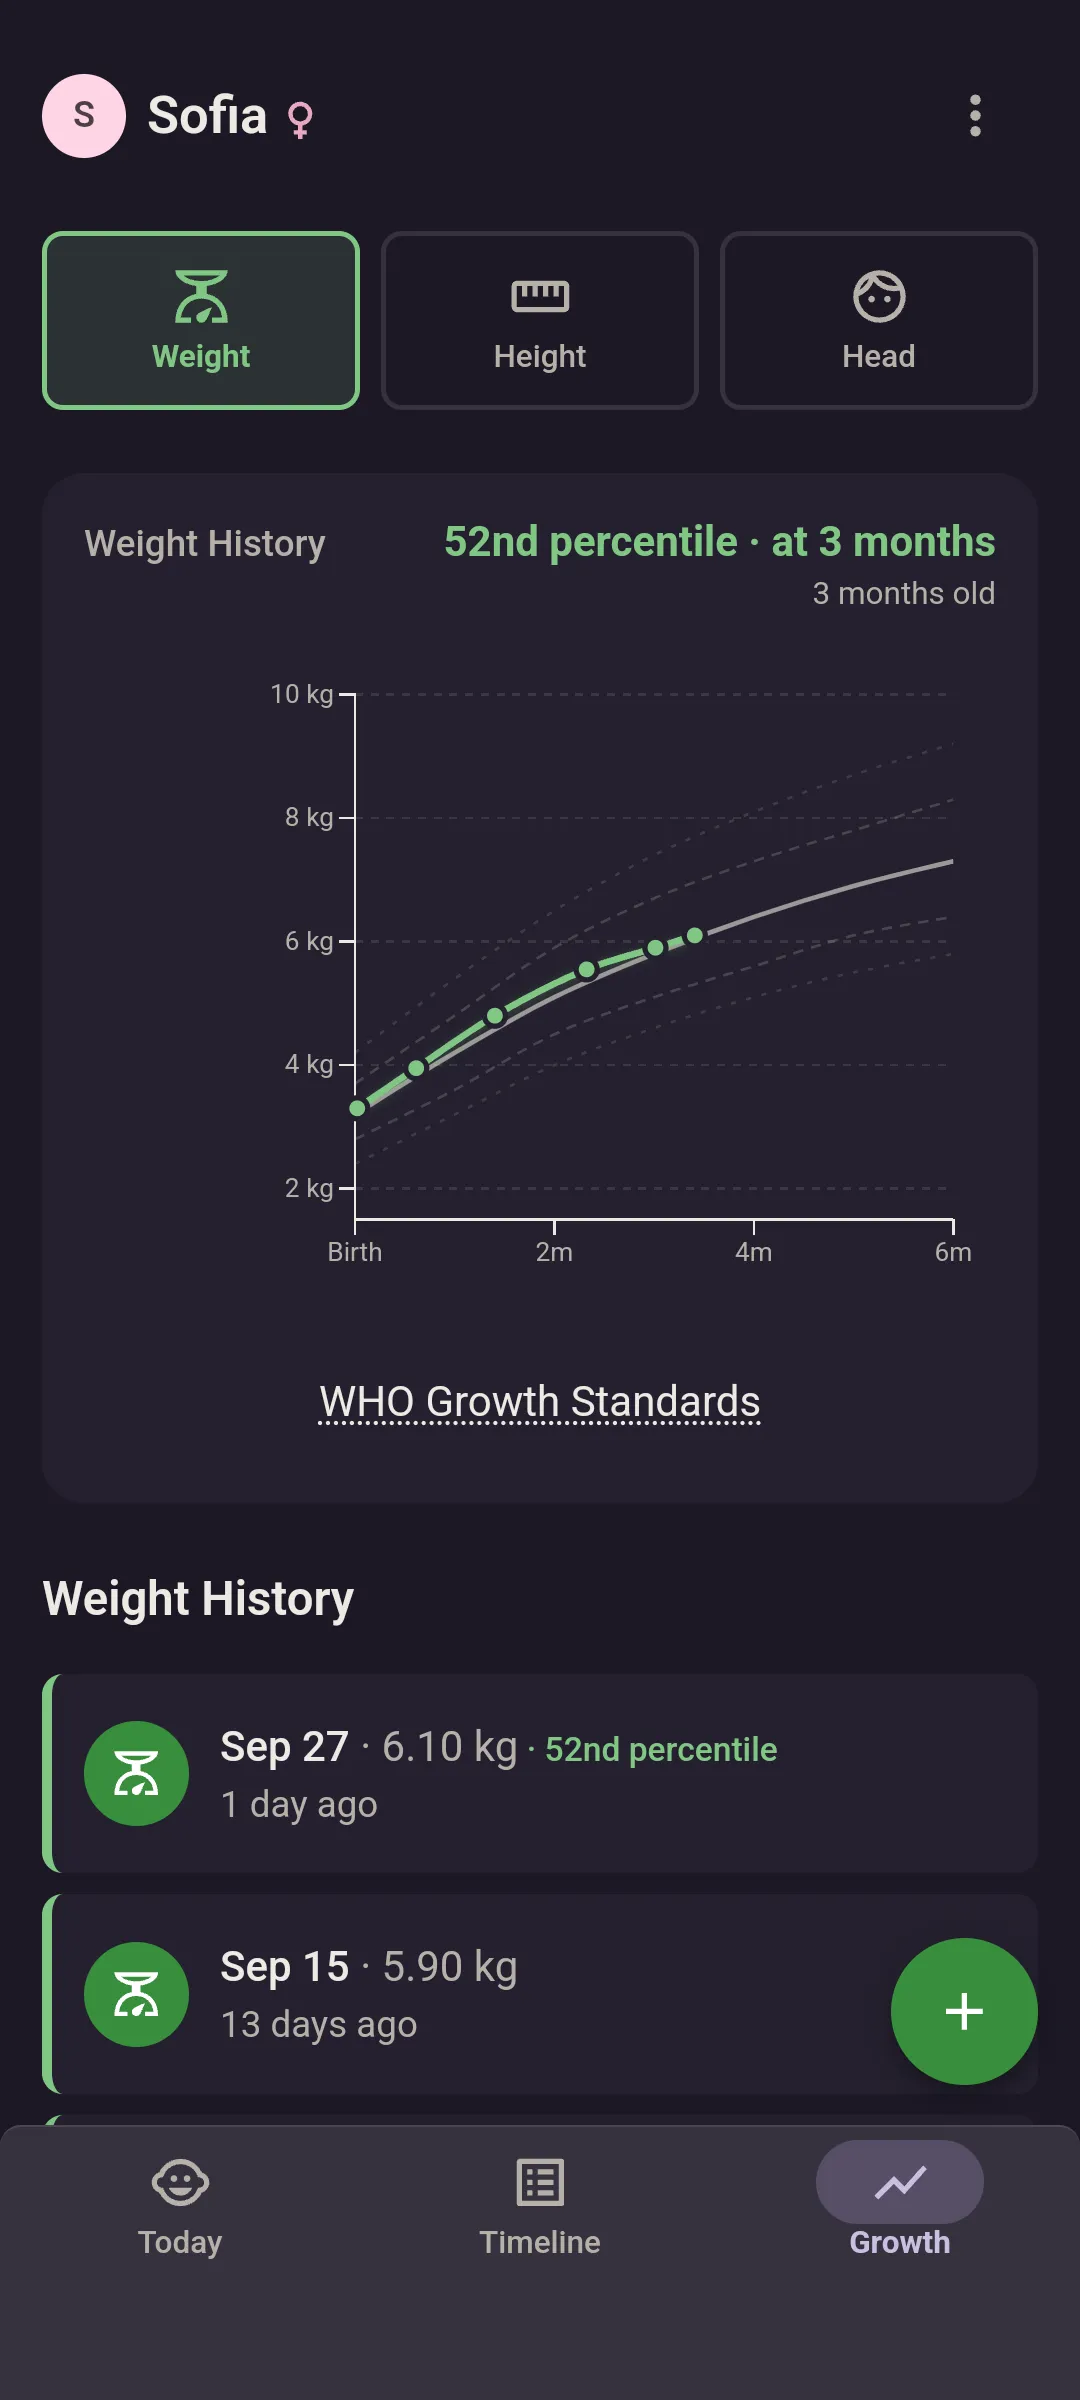
The Growth screen of the baby growth chart app: Sofia’s weight history plotted against the WHO percentile curves, reading 53rd percentile at 3 months, with the latest entry, 6.06 kg on Aug 24, listed underneath.

Charted against the WHO growth standards

A baby growth chart on the WHO standards, with the percentile.

The baby growth chart draws your baby’s own line over the WHO growth standards, for boys and for girls, birth to five years. Your baby’s sex, set when you add them, picks the right set. The chart shows the latest percentile, and each entry in the history underneath shows its own.

  • Weight, height and head circumference, each with its own tab and its own WHO curves.
  • Your baby’s percentile at the age of each measurement.
  • Nothing predicted, nothing projected. The only lines on the chart are the WHO curves and your baby’s own.
  • kg or lb, cm or in. Change units in Settings and the chart follows.
The app shows your numbers. Questions about them are for your pediatrician. There is no score and no advice anywhere in it.

From the scale to the chart

Log it in seconds. See it on the chart.

  1. Weigh.

    At the pediatrician, on the pharmacy scale, or at home.

  2. Log.

    Open Growth, pick the tab, tap the plus, type the number. Measured earlier? Set the time from the chip: an hour ago, a day ago, or the exact date and time. Add a note if you like.

  3. See it.

    The point joins your baby’s line, with its date and percentile in the history.

Whoever was at the appointment enters it. The other parent opens the app to the same chart and the same percentile, and every entry shows who logged it. How sharing works

Temperature gets a plain time series on the same screen, without WHO curves.Premium

The WHO charts and the percentiles are free. Set up in a minute.

Before the appointment

The pediatrician report. One PDF, from inside the app.

“How is feeding going?” is hard to answer from memory at nine in the morning. Generate the report from the header menu, then hand over the last 7 days on paper or send it ahead.

  • Latest measurements with the WHO charts.
  • Feeding pattern: totals, per day, and the time between feeds.
  • Diapers and medicine for the week. How the medicine log works
  • Free, and built from the log you already keep. It needs a connection to generate, and it is always in metric units.
The Today screen: last feed 45 minutes ago, formula 120 ml, with today’s totals; last diaper 1 hour 19 minutes ago, wet and dirty; Vitamin D given 3 hours ago.
The feeds, diapers and medicine on Today are what the report is built from.

What it costs

Growth is not the upsell. Neither is taking your data with you.

  • Growth charts with WHO percentiles. Free, for one baby and two people.
  • Pediatrician report PDF. Free.
  • CSV export of everything, measurements included, whenever you like. Free. Where to find it
  • Delete your account and all its data from inside the app. Free. How your data is handled
The free plan shows the last 7 days of feeds, diapers and everything else on the Timeline. Nothing older is deleted: it is kept, it comes back the moment you upgrade, and the CSV export includes all of it either way. Your measurements stay on the chart. Premium adds your full history, more than one baby, and more than two people. Free vs Premium

Questions

Charts, the report and your data. The short answers.

Is it free?

Yes, to start. The free plan has feeds, diapers, weight, height, head circumference and medicine; growth charts with WHO percentiles and the pediatrician report; 2 people in the family and one baby; the last 7 days of history; dark mode, offline logging and CSV export.

Free vs Premium

Can I export everything?

Yes, to CSV, whenever you like, on the free plan too. Settings, then Data & Privacy.

Can I track more than one baby?

Yes, with Premium. The free plan covers one baby; Premium lets you add more, each with their own timeline, charts and settings, switched with one tap.

Free vs Premium

What happens to entries older than 7 days on the free plan?

Nothing is deleted. Free accounts show the last 7 days; everything older is kept and comes back the moment you upgrade. Your CSV export includes all of it either way.

More in the full FAQ, or write to hello@bundleofjoy.love.

A grey elephant carrying a baby in a blue bundle, three small hearts above its trunk.

Log the next weigh‑in. Start tonight.

Free to start. Weight, height and head circumference on the WHO charts, for both of you.